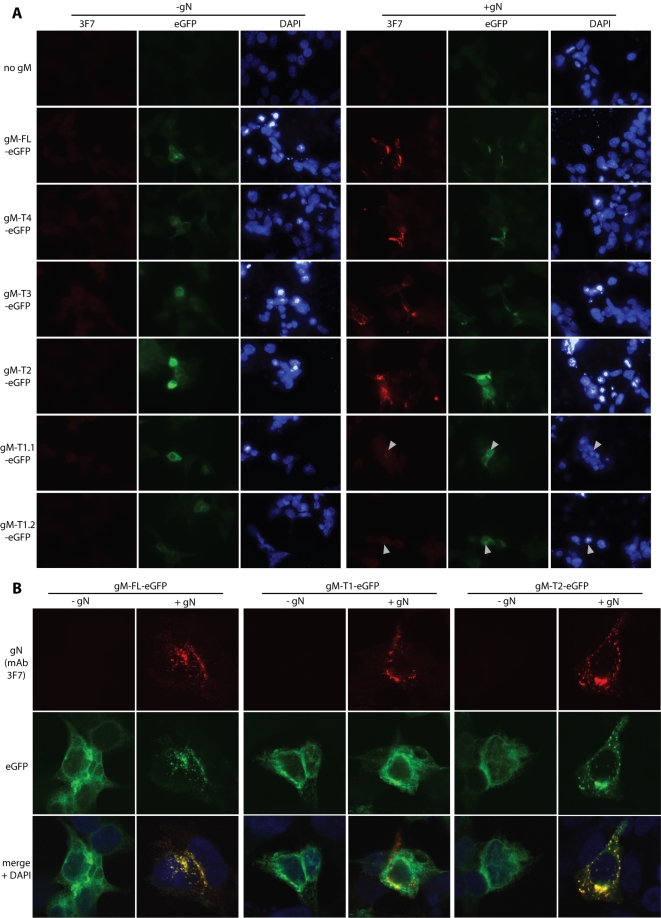
Figure 4. Co-transfection of gM truncation mutants with gN.
A. Each gM-eGFP mutant (T1–T4) or the corresponding full-length form (gM-FL-eGFP) was transfected into 293T cells with or without co-transfected gN. We tested 2 independent gM-T1-eGFP plasmid preparations (1.1, 1.2) to allow for possible poor transfection efficiency. At 48 h post-transfection, the cells were fixed in 2% paraformaldehyde and stained for gN with mAb 3F7 plus Alexa 568-conjugated goat anti-mouse IgG pAb red). EGFP fluorescence was visualized directly (green). Nuclei were counter-stained with DAPI (blue). Representative transfected cells are shown. gN was never visible without co-transfected gM. The data are from 1 of 3 equivalent experiments. B. Higher magnification confocal images made it clear that full-length gM (green) was redistributed when gN (red) was present and that their distributions co-localized almost completely (yellow). The same is seen for the second shortest gM truncation (gM-T2). In contrast, gM-T1 - here, for clarity, a cell with atypically high gN expression has been selected - did not obviously change its distribution when gN was supplied, and their co-localization was much less.

