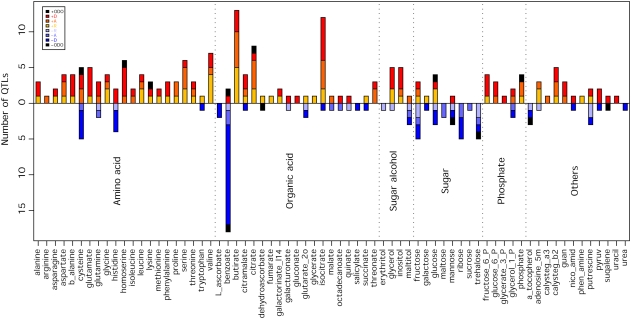
Figure 4.
Distribution of the QTL Mode of Inheritance for Metabolite Accumulation.
Each vertical bar represents the number of QTL for a specific trait, colored according to mode-of-inheritance categories: A, additive; D, dominant; ODO, overdominant; R, recessive. The bars above the 0 line represent the number of increasing QTL, whereas the negative bars represent the number of decreasing QTL relative to M82.

