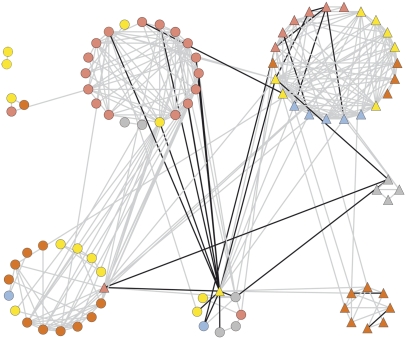
Figure 5.
Cartographic Representation of the Combined Metabolic and Morphological Networks of the ILs.
Each morphological trait (node) is represented by a triangle and color as follows: red, fruit-associated; orange, flower-associated; yellow, yield-associated; gray, seed morphology; light blue, seed yield. Each metabolic trait (node) is represented by a circle and color as follows: red, amino acids; orange, sugars and sugar alcohols; yellow, organic acids; gray, phosphorylated intermediates; light blue, miscellaneous metabolites. Interactions are indicated with lines: gray represents positive correlations and black represents negative correlations. A fully annotated version of this figure is available as Supplemental Figure 8 online.

