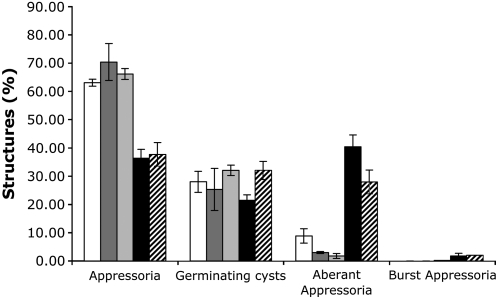
Figure 10.
Percentage of Preinfection Structures Produced by DCB-Treated P. infestans and CesA1-4–Silenced Lines.
White bars, water control; mid-gray bars, 1.25% DMSO control; light-gray bars, combined data from 30 RNA interference control lines treated with GFP dsRNA; black bars, treated with 40 μM DCB in 1.25% DMSO; hatched bars, combined data from RNA interference CesA1-4–silenced lines. Mean ± se from three independent experiments.

