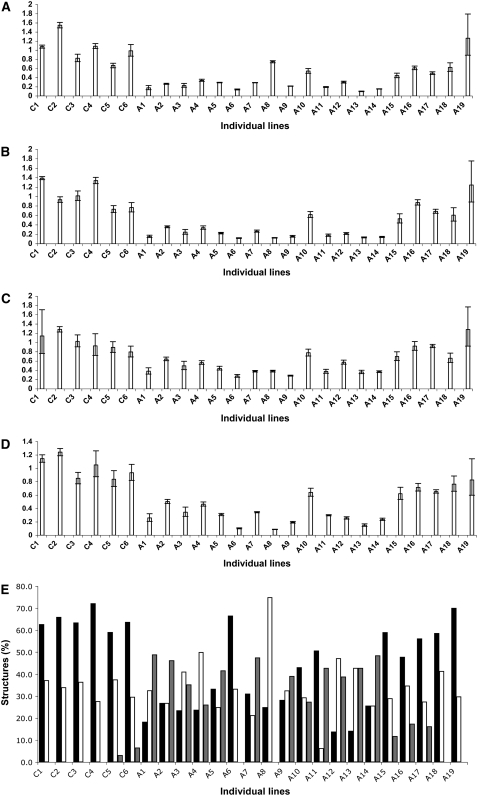
Figure 7.
Expression Levels in CesA1-4–Silenced Lines.
(A) to (D) Relative expression of CesA1, CesA2, CesA3, and CesA4, respectively, in six individual control lines (C1-C6) and 19 individual lines treated with dsRNA from CesA1, CesA2, CesA3, and CesA4 simultaneously (A1-A19). Error bars represent confidence intervals calculated using three technical replicates for each sample within the RT-PCR assay. To allow comparisons of expression levels between lines, expression is shown as a value relative to the mean expression for all control lines for each gene (calibrator value). This calibrator value has been converted to 1.0 to allow comparisons between genes.
(E) Percentages of normal appressoria (black bars), germinating cysts (white bars), and aberrant appressoria-like structures (gray bars) in six individual control lines (C1-C6) and 19 individual CesA1-4–silenced lines. These are the same lines as those shown in (A) to (D).

