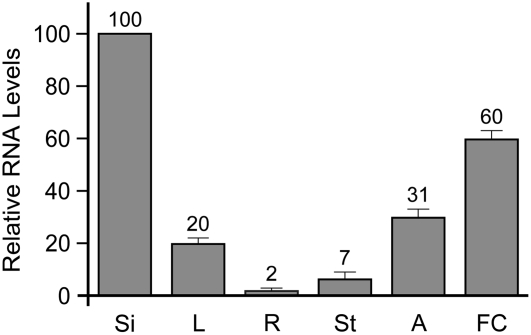
Figure 3.
Real-Time RT-PCR Analysis of AGL62 Expression.
Real-time RT-PCR was performed with cDNAs at 1 to 3 d after pollination from siliques (Si), leaves (L), roots (R), floral stems (St), anthers (A), and flower clusters (FC). Each bar represents an average of three independent reactions, including both biological and technical replicates. In all cases, AGL62 transcript levels were normalized to ACTIN2 levels. Error bars indicate sd.

