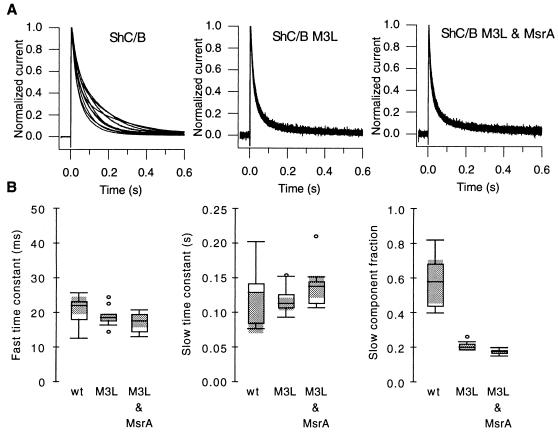
Figure 4.
(A) The M3L mutation accelerates the inactivation time course and eliminates the regulation by MsrA. Currents recorded at +30 mV from cells expressing ShC/B alone (Left, 10 cells), ShC/B M3L alone (Center, 9 cells) and ShC/B M3L and MsrA together (Right, 10 cells) are shown. The mean peak currents for these three groups were 34 μA (SEM = 5.4 μA), 5.1 μA (SEM = 0.74 μA), 2.6 μA (SEM = 0.19 μA), respectively. (B) The M3L mutation specifically decreases the slow inactivation component. The inactivation time course of the currents shown in A was fitted with a sum of two exponentials and the parameters are compared using boxplots. From left to right, the fast inactivation time constant, slow inactivation time constant, and the fractional amplitude of the slow inactivation component are shown. The shaded areas represent the 95% confidence intervals of the median.

