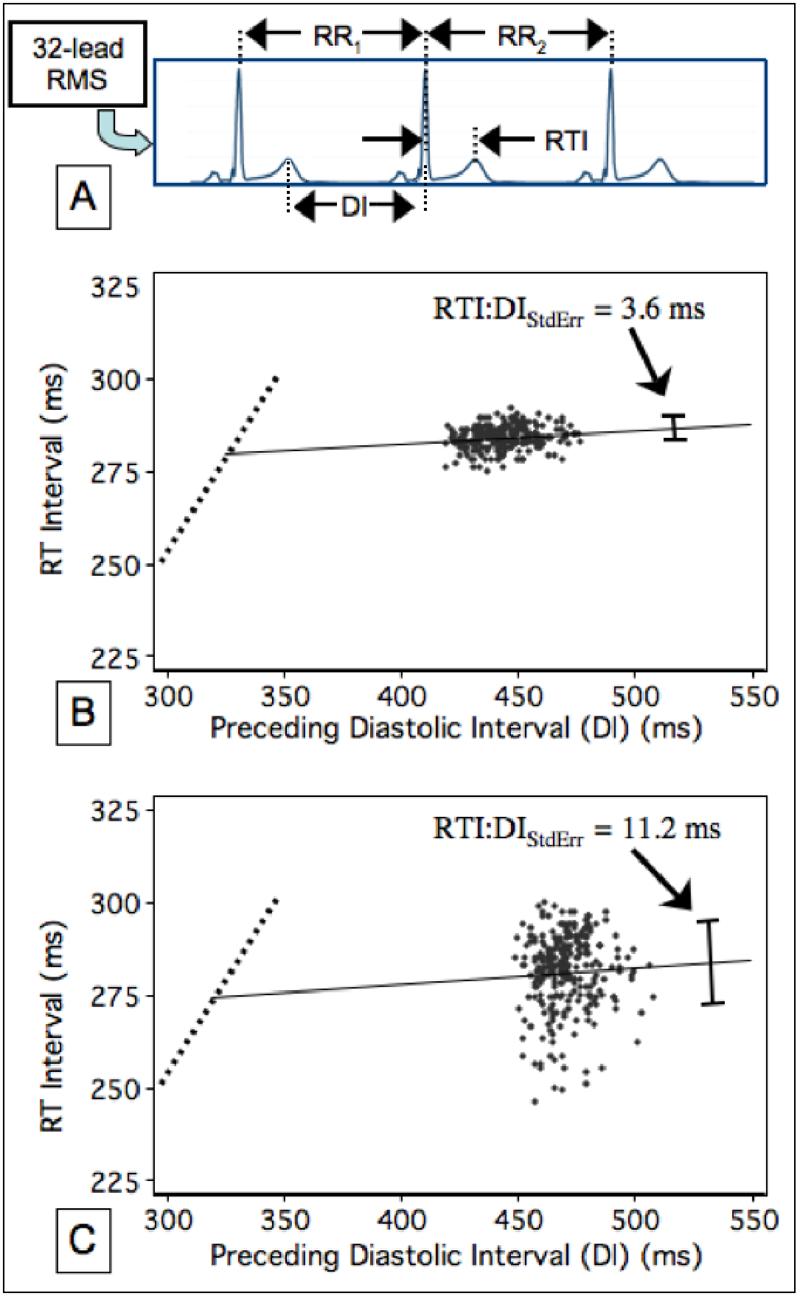
Figure 1.

Assessment of the restitution curves. A) RT intervals (RTIs) are plotted as a function of preceding diastolic intervals (DI) as measured from the root mean square (RMS) of 32-lead resting ECG recordings. B) Example data from a patient in the Non-Event group. The steep portion of the restitution curve (dotted line) cannot be assessed with resting recordings because high heart rates are necessary to observe this restitution behavior. The linear regression estimate of this data is superimposed (solid line), along with RTI:DIStdErr (the standard error of the estimate (whisker bar)). C) Example data from a patient in the Event group, showing a significantly higher RTI:DIStdErr. The heart rate variability, as assessed with CLSD, was actually lower in panel C (5.1 vs. 12ms).
