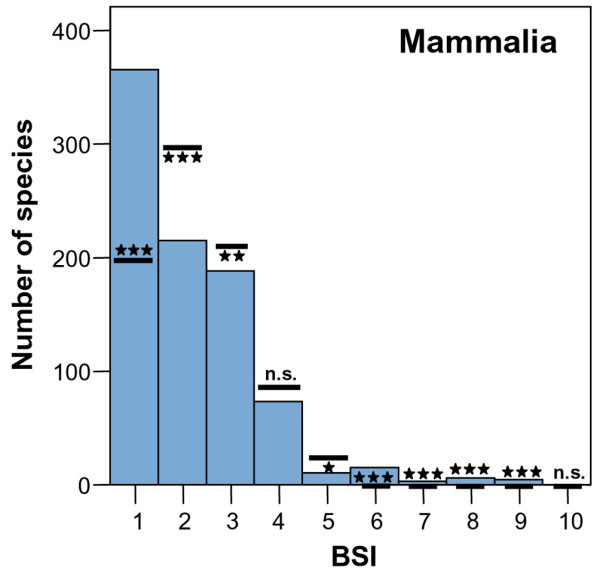
Figure 1.

Frequency distribution of biomic specialization index (BSI) for South American mammals. The lines show the average number of species (± 2 S.E.) for each BSI calculated on 1000 Monte Carlo simulations (Table 2). ***, p < 0.001; **, 0.01 > p > 0.001; *, 0.05 > p > 0.01; n.s., not significant.
