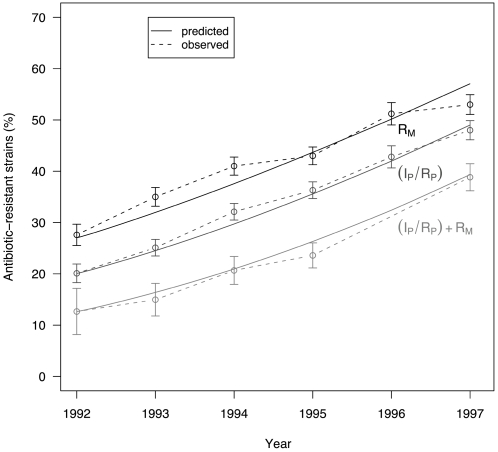
Figure 3. Dynamics of antibiotic-resistant and -multiresistant S. pneumoniae strains, 1992–1997: observed (dashed line) and predicted (black line) percentages.
RM and IP/RP lines correspond, respectively, to macrolide and β-lactam–resistance rates. (IP/RP)+RM represents percentages of β-lactam- and macrolide-multiresistant S. pneumoniae strains.

