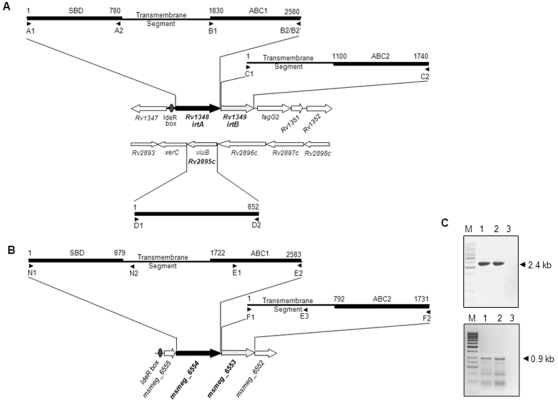
Figure 2. Genomic organization of M.tb irtA, irtB and Rv2895c and their M.smeg counterparts points to their operonic arrangement.
Schematic representation of the location of transporter genes within the M.tb genome (A) and their M.smeg (B) counterparts. The position of the substrate binding domain (SBD), ATP binding cassette (ABC1 and ABC2) and the transmembrane segments of irtA and irtB (A) and msmeg_6554 and msmeg_6553 (B) are indicated. The primers (sequences provided in Table 2) used for amplification are represented as arrow heads below each domain and named as A1 through C2, D1 through D2, N1 through E2 and F1 through F2. Numbers above the domain representations indicate nucleotide position within the gene sequence. (C) RT-PCR of RNA extracted from M.tb H37Rv with primer pair B1+C2 (lane 2), or M.smeg mc2155 with E1+E3 (lane 5) are shown. Corresponding amplification using genomic DNA from M.tb H37Rv (lane 1) and M.smeg mc2155 (lane 1) served as a positive control, while RT-PCR without the inclusion of reverse transcriptase in the reaction buffer was used as negative control (lanes 3 and 6).

