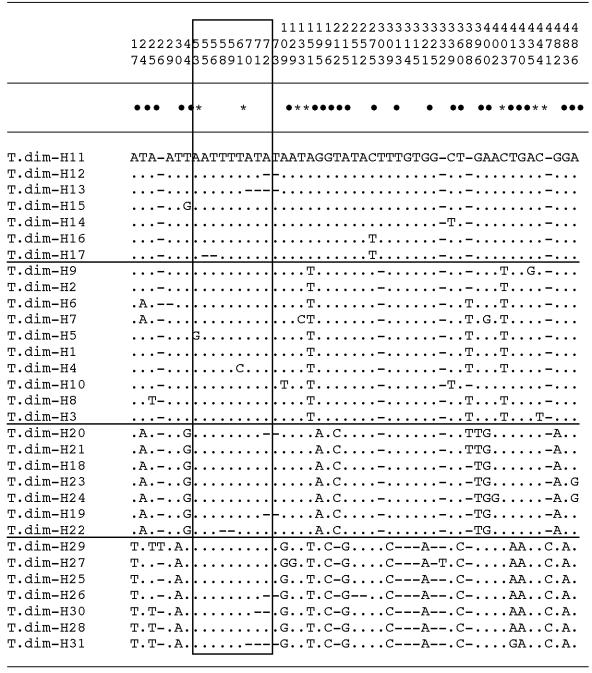
Figure 2. Interhaplotype sequence differences found in the rDNA ITS-2 of the Triatoma dimidiata populations analyzed.
Numbers (to be read in vertical) refer to positions obtained in the alignments made with CLUSTAL-W 1.8 and MEGA 3.3. . = identical; * = singelton sites (7); • = parsimony informative positions (24); − = insertion/deletion. Rectangled area = microsatellite region. Horizontal lines separate the four major T. dimidiata haplotype groupings according to sequence analyses.

