
Figure 3. Median network for Triatoma dimidiata haplotypes based on rDNA ITS-2 sequences.
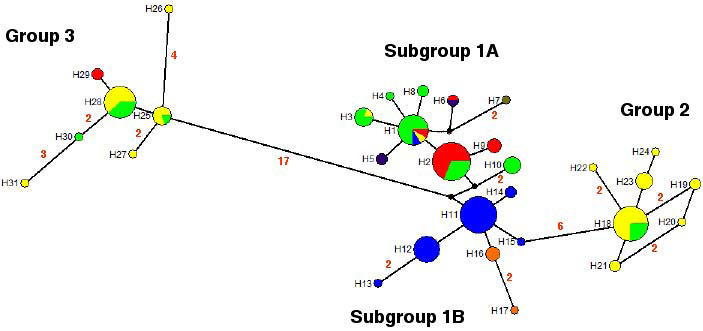
The area of each haplotype is proportional to the total sample. Small black-filled circles represent haplotypes not present in the sample. Mutational steps between haplotypes are represented by a line. More than one mutational step is represented by numbers. H = haplotype. Blue: Colombia; orange: Panama; yellow: Mexico; red: Honduras; lilac: Ecuador; ocher: Nicaragua; green: Guatemala.