
Figure 4. Phylogenetic ML tree of Triatoma species and haplotypes within the Phyllosoma, Rubrofasciata and Infestans groups.
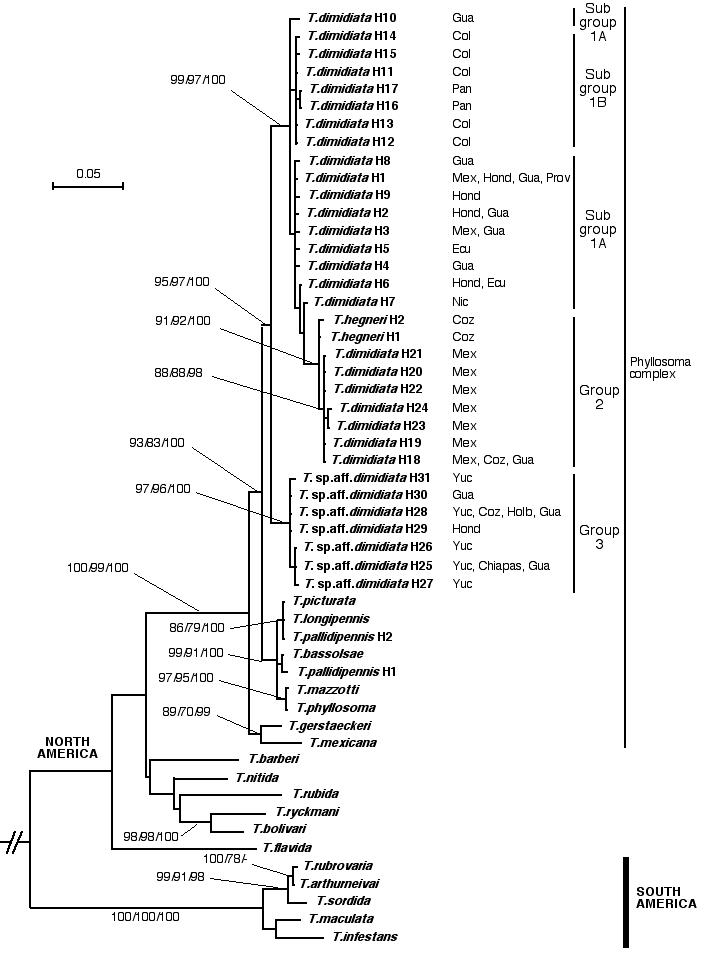
The scale bar indicates the number of substitutions per sequence position. Support for nodes a/b/c: a: bootstrap with ML reconstruction using PhyML with 1000 replicates; values larger than 70%; b: bootstrap with NJ reconstruction using PAUP with ML distance and 1000 replicates; values larger than 70%; c: Bayesian posterior probability with ML model using MrBayes; values larger than 90%.