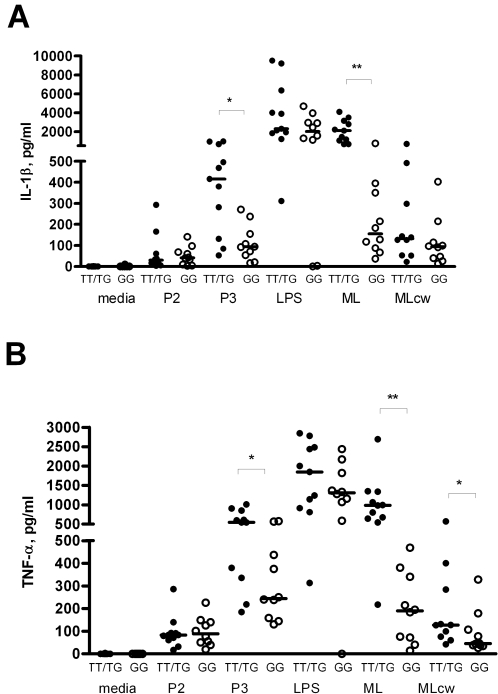
Figure 3. IL-β and TNF-α production in human mononuclear cells following stimulation with M. leprae.
Peripheral blood mononuclear cells were stimulated for 18 hours and supernatants were assayed for cytokine production by luminex multiplex bead assay. PBMCs were obtained from 11 individuals with the genotype 1805TT or 1805TG (TT/TG: dark circles) and 10 individuals with the 1805GG genotypes (GG: open circles). PBMCs stimulated with media, PAM2 at 75 ng/mL (P2), PAM3 at 75 ng/mL (P3), or LPS at 10 ng/ml (LPS), whole irradiated ML at 20 µg/ml (ML) or MLcw at 10 µg/ml (MLcw). IL-1β production following stimulation is shown in (A), and TNF-α production in (B). The mean level and standard error of the mean are depicted and were derived from averaging the responses of individual within each genotype group. The median level is depicted by a bar; *p≤0.05, **p≤0.001 by Mann–Whitney U-test.

