
Figure 3.
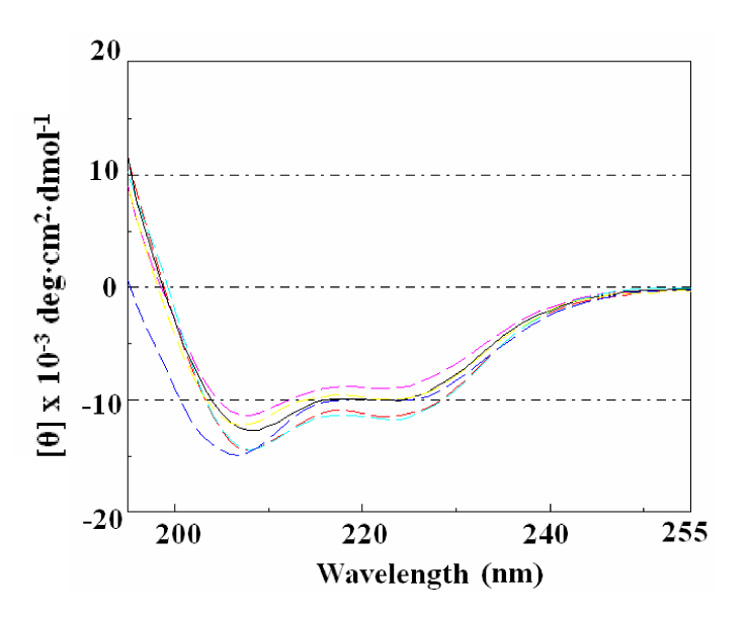
Circular dichroisim spectra of AT proteins. CD spectra of WT and several Ala-substituted AT proteins are shown in WT (black), V02A (red), I03A (yellow), D06A (magenta), D07A (cyan), and E09A (blue) lines. Each AT protein was 200 µg/ml in 50 mM sodium phosphate buffer (pH8.0) and the spectra were recorded at 37 °C.