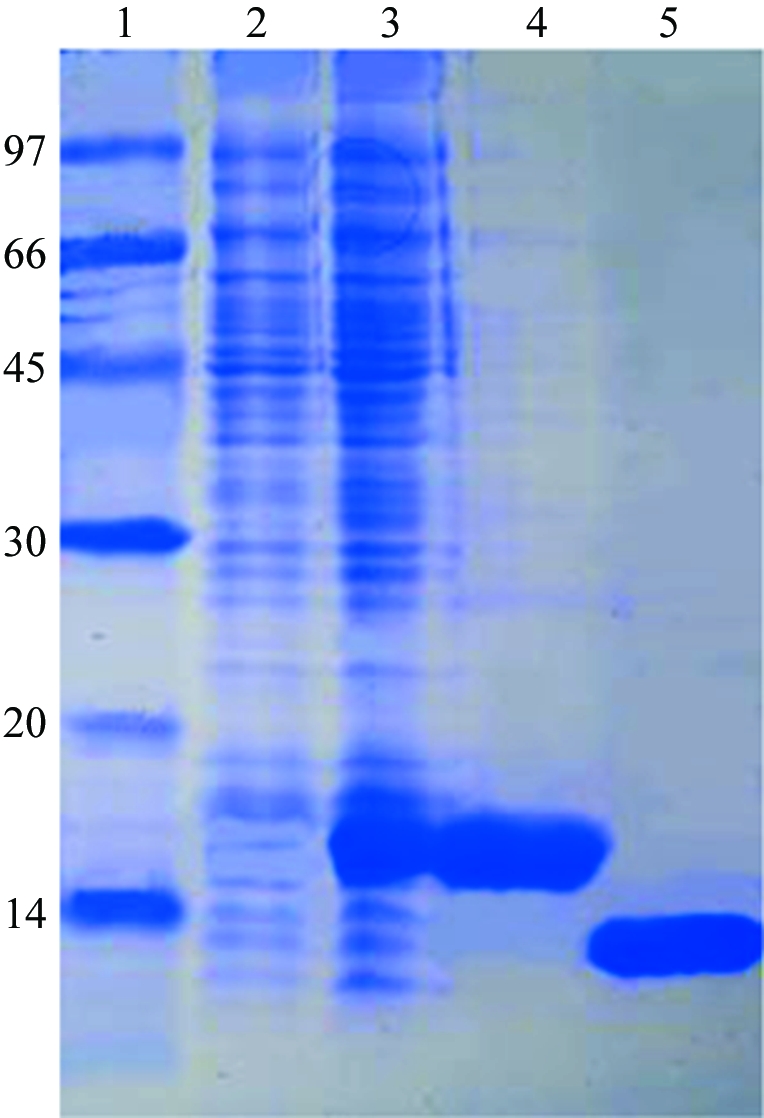
Figure 1.

SDS–PAGE monitoring of the overexpression and purification of XC5848. Lane 1, molecular-weight markers (kDa). Lane 2, whole cell lysate before IPTG induction. Lane 3, whole cell lysate after IPTG induction. Lane 4, purified XC5848 before TEV cleavage. Lane 5, purified XC5848 after TEV cleavage. The location is close to the expected molecular weight of 11 945 Da.
