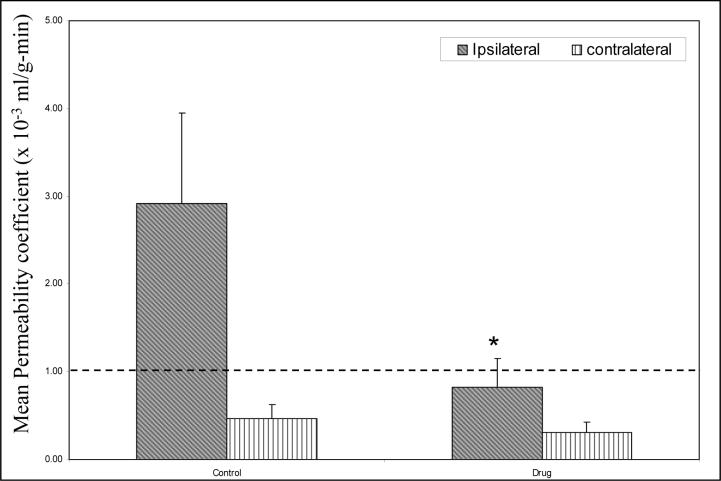
Figure 4.
A plot of mean permeability coefficient estimates in treated (N=6) and control (N=8) rats obtained using the MRI technique. The dashed line represents the upper limit of the range (0−1 × 10⁻³ ml/g-min) of permeability coefficient values in healthy tissue. Rats treated with BB1101 demonstrated a significant reduction in permeability coefficient values on the ischemic side as compared to the untreated rats (ANOVA, *p<0.05, * indicates significant reduction). No significant difference was observed on the contralateral side between the control and treated rats. The Y axis error bars represent standard error of mean.

