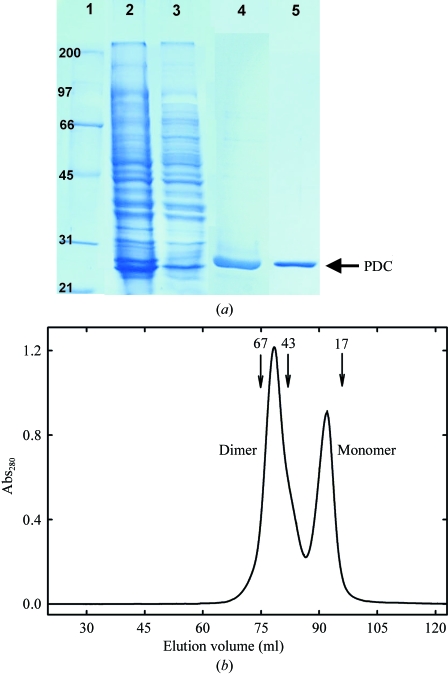
Figure 1.
(a) SDS–PAGE of PDC samples at various steps of the purification process. Lane 1, broad-range (Bio-Rad) molecular-weight markers; lane 2, soluble fraction from E. coli JM109(DE3) cells carrying the plasmid pURI3-PDC after cell disruption; lane 3, flowthrough from the His-Trap FF Ni-affinity column; lane 4, pooled fractions containing PDC eluted from the His-Trap FF Ni-affinity column; lane 5, pooled fractions containing PDC eluted from the HiTrap Q HP column. (b) Gel-filtration chromatography of purified PDC on Superdex 200 prep grade. Two peaks consistent with the molecular weights of monomeric (22.8 kDa) and dimeric (45.6 kDa) PDC species are observed. The positions of molecular-weight standards are shown for comparison.

