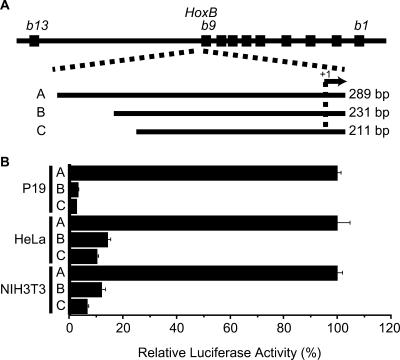
Figure 1.
Luciferase assays of Hoxb9 promoter activity. (A) Diagram of DNA fragments used for analysis. The top-most line represents a map of the HoxB complex. We assessed the effects of three different fragments (A, B and C) on promoter activity. (B) Relative luciferase activities of promoter assay constructs in P19, HeLa and NIH3T3 cells.

