Figure 7.
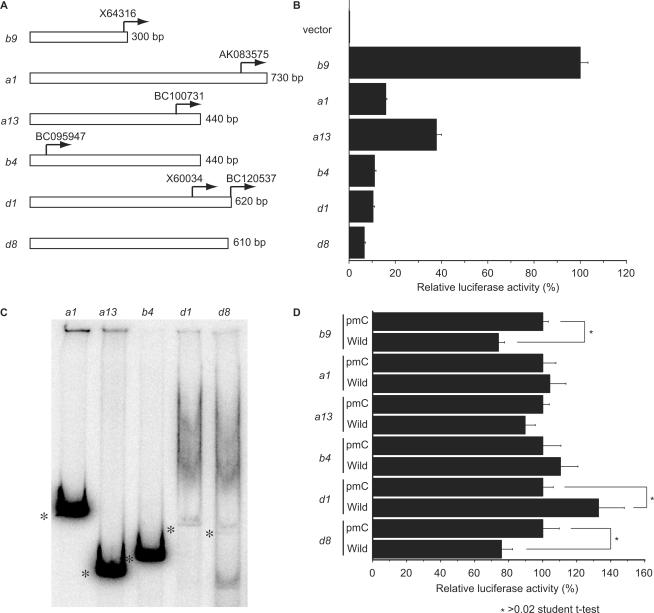
Higher structure formation of Hox promoters. (A) Examples of isolated Hox promoter fragments. Arrows indicate the 5′ end of cDNA sequences annotated in the NCBI sequence library. The transcription initiation site of Hoxb9 was determined previously (11). (B) Relative luciferase activity of isolated promoter fragments. The promoter intensities of these fragments are shown relative to the luciferase activity measured in cells transfected with Hoxb9 constructs, which was set to 100. The negative control (luciferase vector lacking a promoter fragment) did not show any traces of activity. (C) Native gel electrophoresis of Hox promoter fragments. The fragments from Hoxa1, Hoxa13 and Hoxb4 did not exhibit multiple bands, while the fragments from Hoxd1 and Hoxd8 separated into multiple bands, as observed with Hoxb9 (Figure 2). Asterisks mark linear portions of the DNA fragments. (D) Effects of Fbxl10 on Hox promoters. Each luciferase construct was co-transfected with an Fbxl10 expression construct. Co-transfection experiments with the pmC construct represented control experiments (Figure 5). Overexpression of wild-type Fbxl10 influenced luciferase activity in cells co-transfected with either Hoxd1 or Hoxd8 promoter fragments, fragments that take on a higher structure like Hoxb9. By contrast, wild-type Fbxl10 and pmC Fbxl10 failed to significantly influence luciferase activity in cells co-transfected with Hoxa1, Hoxa13 or Hoxb4 promoter fragments. Asterisks indicate significant differences compared to cells expressing the control vector according to the Student's t-test (P < 0.03).

