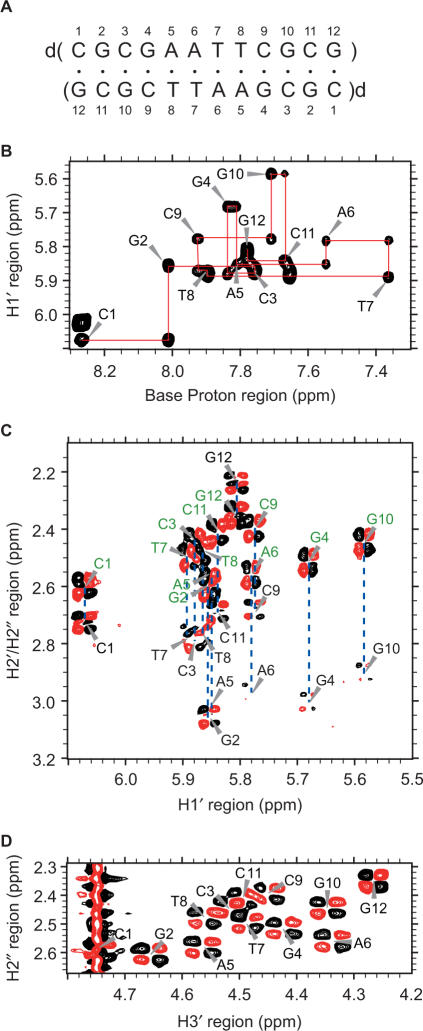
Figure 1.
(A) The sequence and numbering of fully modified 4′-thioDNA. (B) The H6/H8-H1′ region of the NOESY spectrum of 4′-thioDNA. The H1′ (i − 1)–H6/H8(i)–H1′ (i) connectivities are traced, the intraresidue correlation peaks being labeled with the residue numbers. The H1′–H2′ (labeled in black) and H1′–H2″(labeled in green) regions (C) and the H2″–H3′ region (D) of the DQF-COSY spectrum of 4′-thioDNA.

