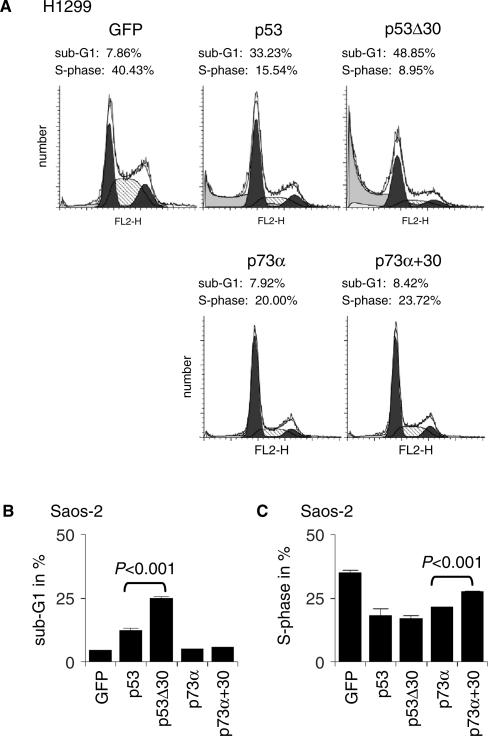
Figure 8.
The p53 CTD inhibits the p53/p73 response. (A) H1299 cells were infected with adenoviruses expressing GFP alone or in combination with p53, p53Δ30, p73α or p73α+30. Protein levels obtained by adenoviral infection are shown in Figure 7B. Shown are the cell cycle profiles measured 24 h after infection. (B, C) Quantitative analysis of (B) apoptosis (sub-G1) and (C) S-phase 24 h after Saos-2 cells were infected and analyzed as described in (A). The observed differences are statistically significant as determined by two-sided Student's t-test.

