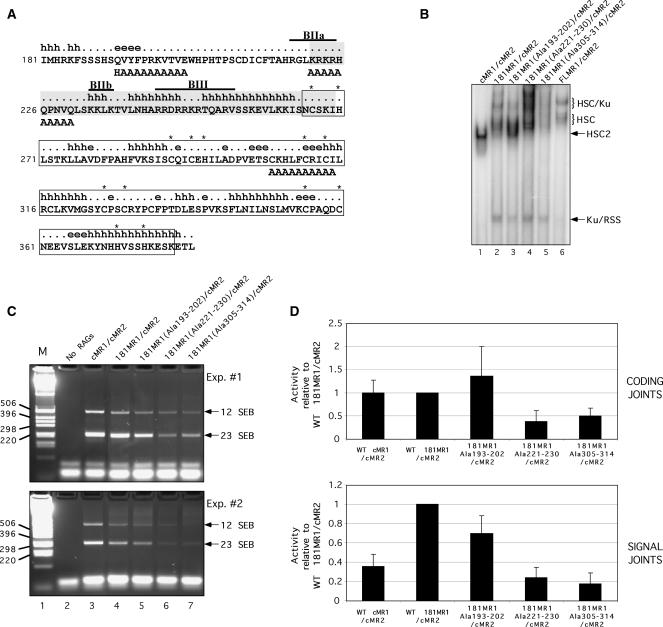
Figure 6.
Identification of RAG1 NTD alanine replacement mutants that exhibit altered association with Ku70/Ku80. (A) Diagram of part of the RAG1 NTD. The amino acid sequence of murine RAG1 residues 181–383 are shown with secondary structure state predicted using the APSSP2 server (h, alpha helix; [.], coil; e, beta strand) (55). A structurally disordered region by the ‘hot-loops’ definition as determined using DisEMBL version 1.4 is shaded (40). The Zn-RING dimerization motif characterized by crystallography is boxed (39). Cysteine and histidine residues coordinating zinc ions are indicated by asterisks. The locations of small basic motifs are indicated by overlines and identified as BIIa, BIIb and BIII as described previously (38). Alanine substitutions in the three 181MR1 mutants are positioned beneath the residues targeted for replacement. (B) EMSA of 181MR1 mutant RAG protein preparations. WT cMR1, FLMR1 or 181MR1, or mutant forms of 181MR1 were co-expressed with cMR2 and purified from 293 cells using the mild procedure. Radiolabeled intact 12-RSS substrate was incubated with HMGB1 and the various RAG preparations and RAG–RSS complex formation was analyzed by EMSA. (C–D) V(D)J cleavage and recombination activity of 181MR1 alanine replacement mutants in cell culture. HEK293 cells were cotransfected with WT or mutant cMR1 or 181MR1 and cMR2 expression constructs together with the plasmid V(D)J recombination substrate pJH299 in the combinations indicated. (C) SEBs at the 12-RSS and 23-RSS were detected by LM-PCR and indicated by arrows at right. (D) Formation of coding joints (upper panel) and signal joints (lower panel) was analyzed using real-time PCR. Data was analyzed using the comparative threshold approach using amplification of a fragment of the chloramphenicol acetyltransferase gene as a calibrator and PCR reactions using template DNA recovered from panel E, lane 2 (‘No RAGs’) for normalization. The data is presented as the mean fold difference in the 2−ΔΔCt value between a given combination of RAG proteins and WT 181MR1/cMR2 (hence, the value obtained for WT 181MR1/cMR2 is always ‘1’). The error bars represent the standard deviation of the mean fold difference obtained from four independent experiments.

