
Figure 2. Deletion in GCH1.
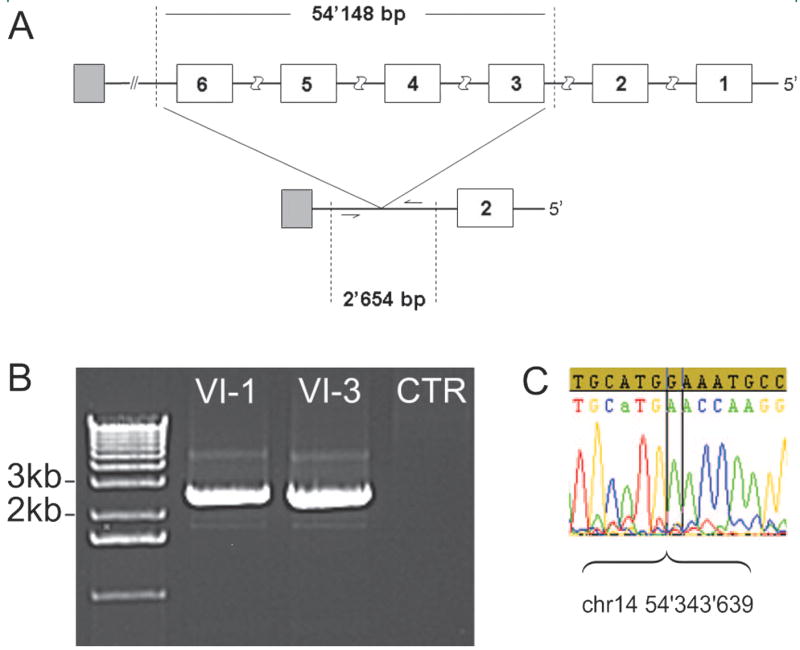
(A) The upper panel shows the wild type gene with GCH1 exons numbered 1 to 6 (in white), the deleted segment (vertical dashed lines), and the neighboring gene SAMD4A (in gray); the lower panel shows the mutant gene with the deletion, delineating the fragment (dashed lines) amplified in (B) in individuals VI-1 and VI-3. (C) Sequence chromatogram showing where the deletion starts (sample sequence not matching the wild type sequence). Note the CATG preceding the breakpoint, which may map to either the 5′or the 3′ end of the deletion.