
Figure 3.

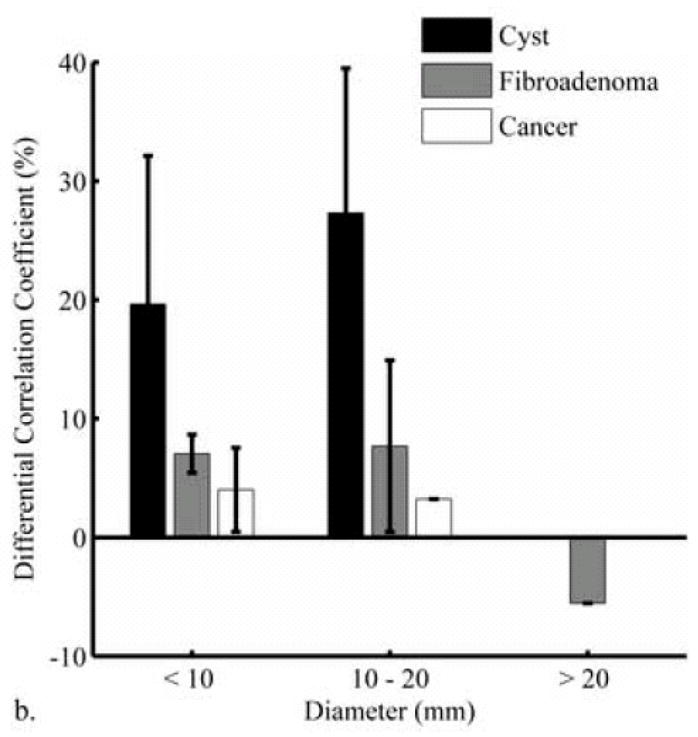
Analysis of differential correlation coefficient (DCC) values grouped according to lesion depth (a) and diameter (b). Statistical comparison was not possible due to the low number of lesions in each group. The most overlap between lesion types occurred at the greatest depths analyzed in this study, most likely due to the decorrelation being dominated by the low signal-to-noise (SNR) in the lesions. Characterization of small (< 10 mm) lesions may not be adversely affected by this technique, if partial volume averaging and sidelobe “fill in” do not dominate DCC values.