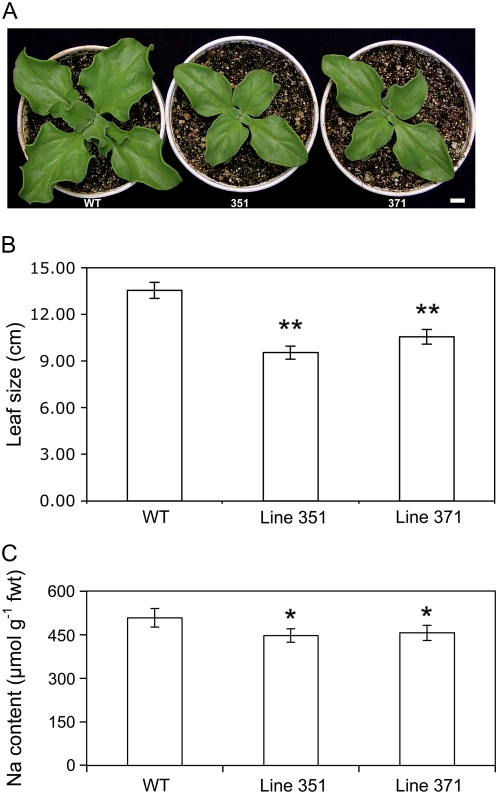
Figure 3.
Growth and sodium content of the leaves and shoots of wild type (WT) and two CAM-deficient lines of common ice plant. A, Representative plants (bar = 1 cm). B, Shoot growth of WT and two CAM-deficient lines (351 and 371) sampled after 28 d of growth under unstressed conditions. Each bar is the mean of 39 plants ± sd. Student's t test P value between WT and 351: P = 2.2 × 10⁻¹⁶** and between WT and 371: P = 1.6 × 10⁻¹⁰**. C, Sodium content of the leaves and shoots of WT and two CAM-deficient lines (351 and 371) sampled after 14-d treatment with 0.3 m NaCl. Each bar is the mean of four plants ± sd. Student's t test P value between WT and 351: P = 2.5 × 10⁻⁵* and between WT and 371: P = 1.9 × 10⁻⁴*.

