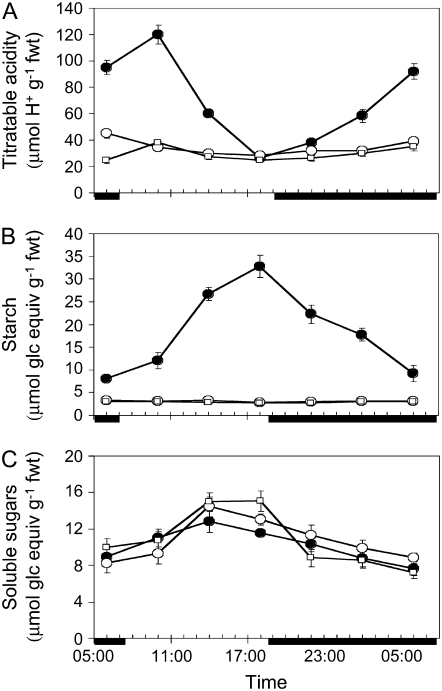
Figure 5.
Day/night changes in titratable acidity (A), starch (B), and soluble sugar (C) content in leaves sampled from wild type (black circles) and two CAM-deficient lines, 351 (white squares) and 371 (white circles), after exposure to 0.3 m NaCl for 14 d. Each point is the mean of four replicates ± se. Solid bars on the x axes represent the periods of darkness.

