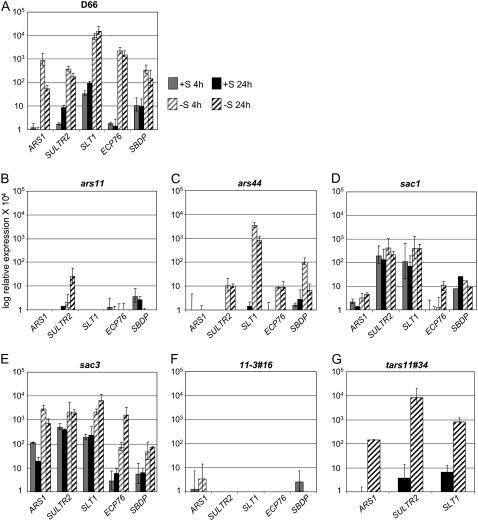
Figure 2.
qPCR analysis of S-regulated gene expression. The parental strain (A) and mutants (B–E) were grown on TAP medium, washed with TAP-S medium, and then resuspended in either TAP or TAP-S. Samples were taken for qPCR analysis at 4 and 24 h following the transfer of exponentially growing cells to fresh TAP or TAP-S. Levels of individual transcripts are given as relative fold abundance with respect to the housekeeping control gene (CBLP). None of the values obtained was much below 1, and those values that were below 1 are represented as 0 on the graphs. Experiments were performed in triplicate. For the 11-3#16 double mutant, the transcript levels were analyzed only at 4 h (F), and for the SNRK2.1 complemented strain, tars11#34, the ARS1, SULTR2, and SLT1 transcript levels were analyzed at 24 h (G). The strains used for these analyses were D66, ars11 and ars44 (snrk2.1−), tars11#34 (complemented with SNRK2.1), sac1 (sac1 mutant), sac3 (sac3 mutant), and 11-3#16 (ars11 sac3 double mutant).

