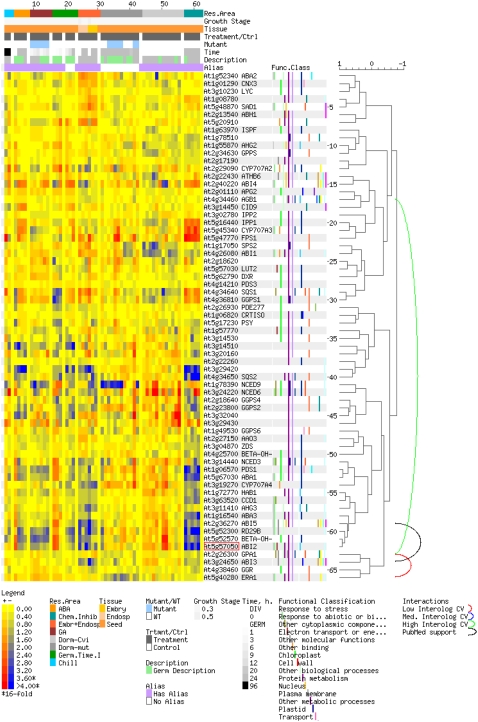
Figure 2.
ABA TAGGIT ontology. TAGGIT ontology categories showing expression data for these genes across all seed microarray experiments are shown. The ABI2 gene is highlighted with a red box. Hierarchical clustering of expression data is represented by the tree to the right, and the curved lines demonstrate confirmed and predicted protein-protein interactions (Geisler-Lee et al., 2007).

