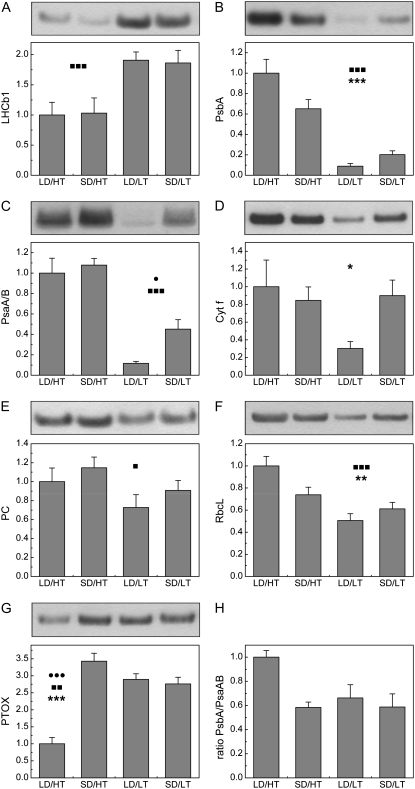
Figure 1.
The effect of daylength and temperature on the expression levels of key proteins of the photosynthetic electron transport chain in needles of P. banksiana. The average optical density of the LD/HT treatment was arbitrarily scaled to 1. Typical bands from the original western blots, loaded on an equal protein basis, are shown above the values. Each value represents the average of n = 8 ± se biological replicates. Two-way ANOVA indicates statistically significant differences due to daylength, temperature, or an interactive effect of both factors. •, ▪, and * indicate significant differences due to daylength, temperature, and their interactive effect, respectively. One symbol, P < 0.05; two symbols, P < 0.01; three symbols, P < 0.001.

