Figure 6.
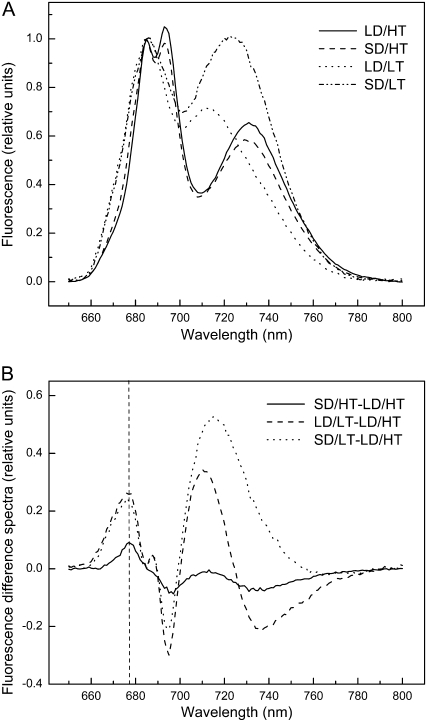
The effect of daylength and temperature on low-temperature (77 K) fluorescence emission properties in P. banksiana needles grown under different daylength and temperature regimes. A, Fluorescence emission spectra (excited at 436 nm) of the four different treatments. The spectra were normalized to the peak at 685 nm. Each trace represents the average of n = 8 independent biological replicates. B, Corresponding difference spectra SD/HT − LD/HT, LD/LT − LD/HT, and SD/LT − LD/HT. The chlorophyll concentration of all samples was 5 μg mL−1.

