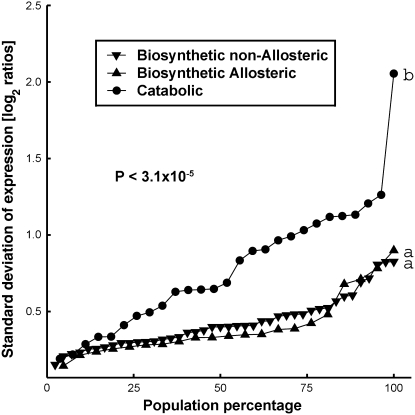
Figure 2.
Distribution of the degree of fluctuations of mRNA levels of the entire sets of biosynthetic/nonallosteric (inverted triangles), biosynthetic/allosteric (triangles), and enzymes catalyzing the first catabolic step of the amino acids (circles) genes of the four metabolic networks described in Figure 1 in response to eight different abiotic stresses (both in shoots and roots). The degree of fluctuation of the mRNA levels was estimated using sd of expression (log2 ratio of treatments versus controls), and the values in each group were sorted along the x axis. Different letters (a and b at the right of each curve) represent statistically significantly different groups (P < 3.1 × 10⁻⁵).

