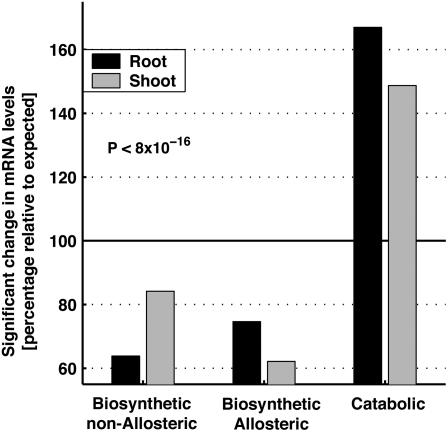
Figure 3.
Comparison of the relative number of cases in which mRNA levels of genes belonging to each of the groups of the biosynthetic/nonallosteric enzymes, biosynthetic/allosteric enzymes, and the enzymes catalyzing the first catabolic step of the amino acids, derived from the four metabolic networks described in Figure 1, in response to the eight different abiotic stresses. Results are presented for roots and shoots separately. Each histogram represents the actual number of cases in which a statistically significant response was observed relative to the expected number of cases assuming no preferential response of each of the groups (see “Materials and Methods” for details). The hypothesis of no preferential response was rejected using a χ2 test (P < 8 × 10⁻¹⁶).

