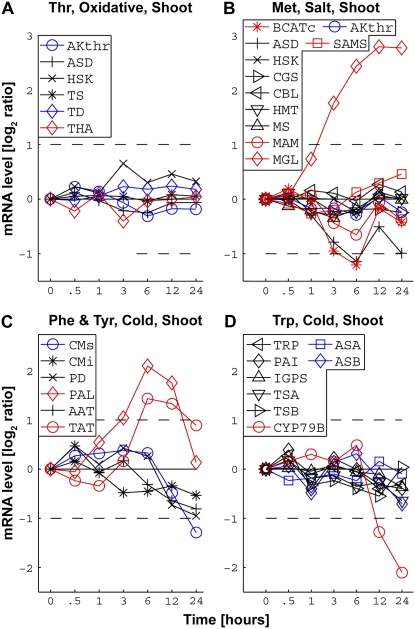
Figure 4.
The responses of combined isozymic mRNA levels of genes encoding isozymes of exemplary metabolic pathways to representative stress conditions in shoots. The combined isozymic mRNA levels of genes encoding biosynthetic/allosteric enzymes, biosynthetic/nonallosteric enzymes, and enzymes catalyzing the first catabolic steps of the amino acids are indicated by blue, black, and red lines, respectively. The names of the enzymes encoded by the different isozymic genes, as provided in Table I, are given in the boxes of each panel. A, Response of the Thr pathway to oxidative stress. B, Response of the Met pathway to salt stress. C, Response of the Phe and Tyr pathway to cold stress. D, Response of the Trp pathway to cold stress. The changes in mRNA levels are given in log2 ratios of treatments versus controls (y axes on the left). Only values greater than 2-fold increased or 2-fold decreased in mRNA levels (broken horizontal lines) were considered to be significant changes.

