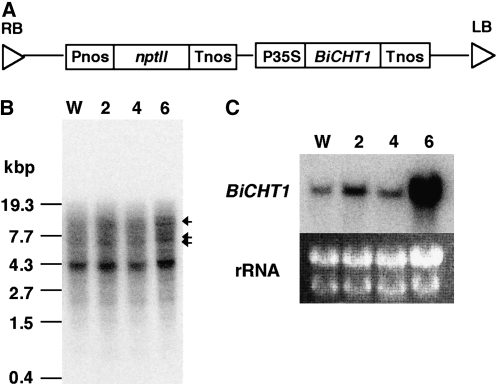
Figure 4.
Confirmation of the introduced gene (BiCHT1) and its expression. A, Map of the T-DNA region of the binary vector. B, Southern-blot analysis of transformants (cell lines T2, T4, and T6) and wild-type bromegrass cells (W). Arrows indicate the amplified copies of the introduced gene BiCHT1. C, Northern-blot analysis of BiCHT1 mRNA from transgenic lines (T2, T4, and T6) and wild-type cells (W) grown for 7 d at 25°C.

