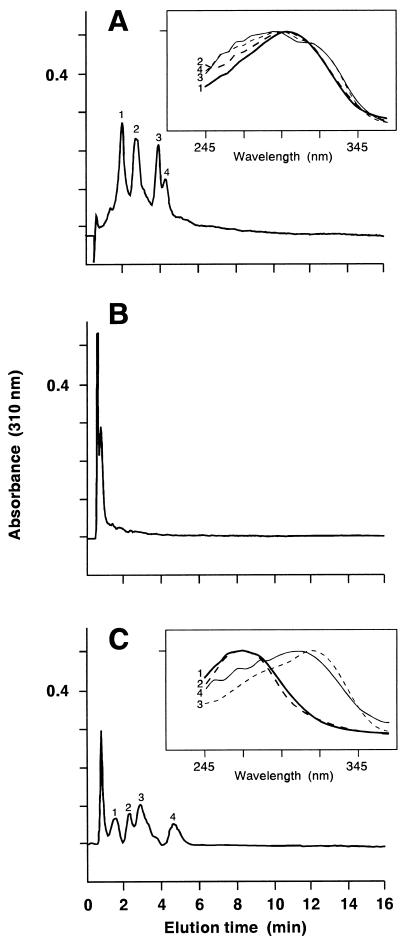
Figure 5.
HPLC profiles of albicidins before and after the AlbD enzymatic reaction, analyzed by isocratic elution with (A and B) 60% methanol in water containing 1% (vol/vol) acetic acid or (C) 50% methanol in water containing 1% acetic acid at a flow rate of 1 ml/min through a C18 analytical HPLC column [40 × 4.6 mm (Beckman)]. (A) Untreated albicidins; (B, C) products from treatment of albicidins with AlbD enzyme. The first peak in the HPLC profiles is the injected solvent front. Insets in A and C are the overlaid absorption spectra of the separated peaks.

