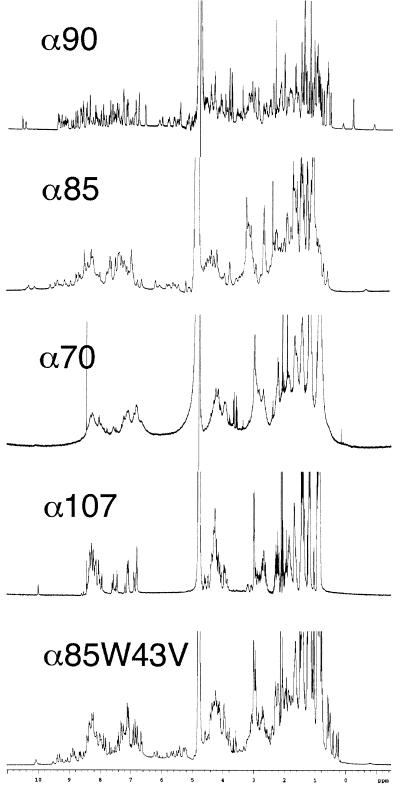
Figure 2.
Proton NMR spectra of α90, α85, α70, α107, and α85W43V. The decrease in dispersion from α90 to α85 to α70 reflects a graded decrease in protein structural order. α107 appears unfolded. α85W43V has narrower lines and greater dispersion than α85, indicating that the single Trp → Val mutation reduced conformational flexibility. The sharp peaks at 8.45 and 0.15 ppm in the α70 spectrum are impurities.

