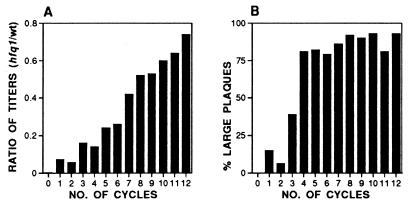
Figure 1.
Course of the adaptation as followed by plaque-forming characteristics. The data shown are from adaptation experiment 3.2 and are representative for all others. (A) Relative plating efficiency. Ratios of the phage titers as determined on E. coli Q13 hfq1 and on wild-type E. coli Q13 for the successive lytic cycles. In the initial lysate (cycle 0) this ratio was 10−4. (B) Plaque morphology. Percentage of plaques with a diameter of 1 mm or more on E. coli Q13 hfq1 in the successive lytic cycles. For wild-type phage plated on wild-type E. coli Q13, this fraction is 95–100%.

