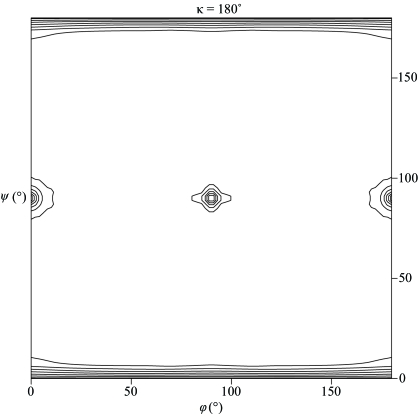
Figure 2.
Plot of the self-rotation function at κ = 180°. The self-rotation function was calculated using data between 15 and 4 Å. Only peaks corresponding to the crystallographic twofold symmetry are visible, which suggests that the noncrystallographic axis may be orientated parallel to the crystallographic axis. The map is contoured from the 1.8σ level in steps of 0.9σ.

