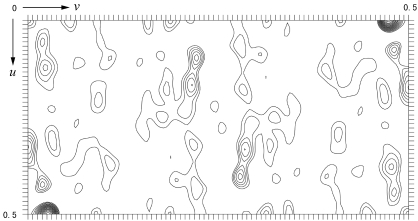
Figure 3.
Harker section (u, v, 1/2w) of the native Patterson map calculated using data between 20 and 4 Å. The large peak located at (u, v) = (0, 0.4750) corresponds to the translation vector between corresponding atoms in the subunits of the dimer in the asymmetric unit, whose axis is parallel to the crystallographic twofold screw axis. The map is contoured from 1.0σ in steps of 1.0σ.

