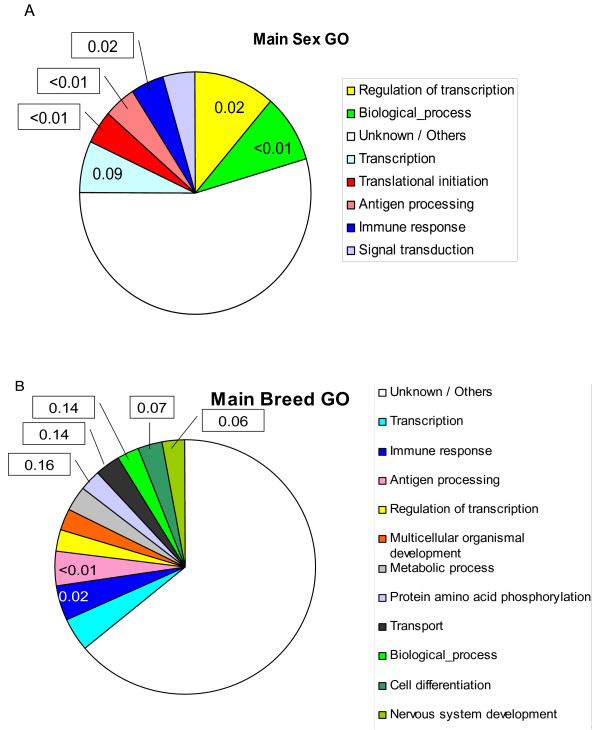
Figure 6.
Proportion of functional annotation categories. Percentage of the most frequent GO categories within the most significant differentially expressed genes between sexes (Table 3) and between breeds (Table 4). The number in each category is the false discovery rate (FDR) that the category is over represented with respect to the GO frequency across all genes in the microarray. The FDR is shown only if < 0.20.

