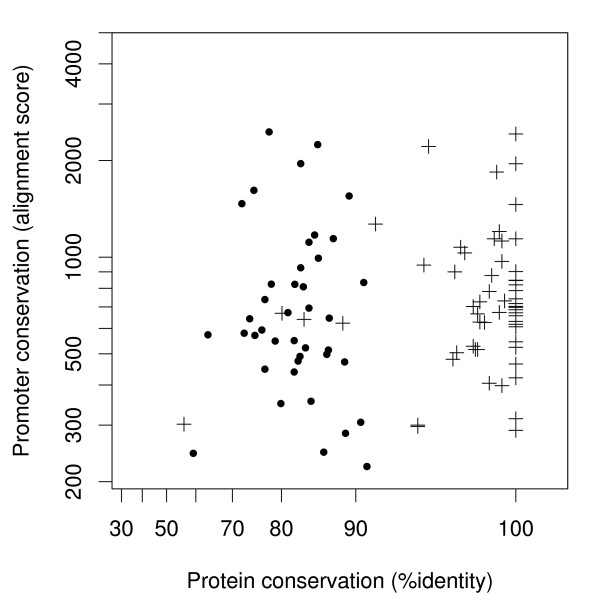
Figure 4.
Scatter plot of protein conservation and promoter conservation for two subsets of ribosomal proteins. Crosses represent cytoplasmic ribosomal proteins (58 genes). Dots represent mitochondrial ribosomal proteins (41 genes). The conspicuous outlier corresponding to (56, 302) does not seem to be an actual ribosomal protein, and might have been erroneously annotated by an electronic procedure (see Additional file 9).

