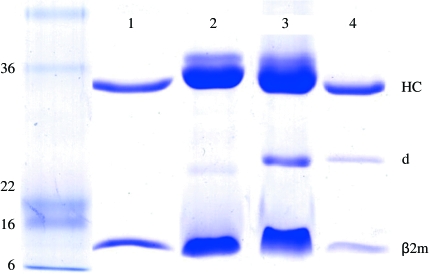
Figure 1.
SDS–PAGE analysis of refolded HLA-B*1402–pLMP2 (lanes 2 and 3, about 75 µg each) and HLA-B*1402–pCatA (lanes 1 and 4, about 20 µg each) complexes. Purified complexes were electrophoretically analyzed under reducing (lanes 1 and 2) and nonreducing conditions (lanes 3 and 4) using Coomassie Brilliant Blue stain. Approximate molecular weights of marker proteins are indicated in kDa on the left. HLA-B*1402 heavy-chain (HC) and β2-microglobulin (β2m) bands are indicated. A faint β2m dimer (d) band is visible under nonreducing conditions (lanes 3 and 4) and even under reducing conditions when very high amounts of HLA–peptide complex are loaded onto a gel (lane 2). This has so far not been observed to hinder crystallization of the complex.

