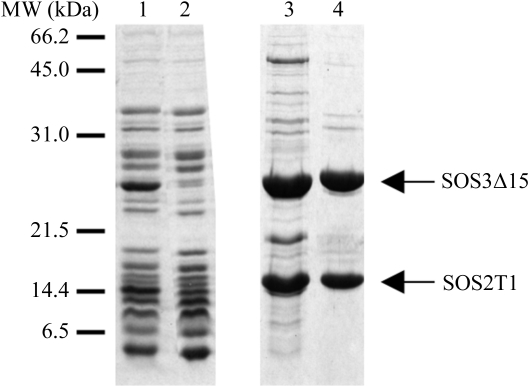
Figure 1.
Expression and purification of the SOS3Δ15–SOS2T1 complex. Lane 1, flowthrough from the anion-exchange column. Lane 2, flowthrough from the cation-exchange column. Lane 3, the fraction eluted with 125 mM NaCl buffer from the cation-exchange column. Lane 4, the main peak from the permeability column. Proteins were analyzed using 15% SDS–PAGE gels. Gels were stained using Coomassie Brilliant Blue.

