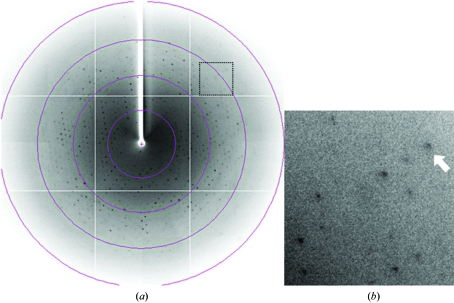
Figure 4.
Diffraction pattern of the crystal of mGluR7 LBD. (a) A typical 1° oscillation photograph. The concentric circles indicate resolution ranges of 10.7, 5.3, 3.6 and 2.7 Å. (b) A close-up view of the region marked by a dotted line in (a). The arrow indicates a diffraction spot at 3.3 Å resolution.

