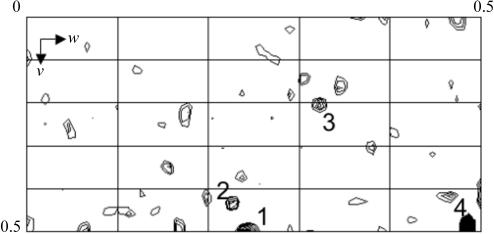
Figure 2.
Harker section (w = 0.5) of the anomalous difference Patterson map of the MafB–Cmare DNA complex cocrystallized with 2 mM HgCl2 calculated at a resolution of 4 Å using data collected at a wavelength of 0.9535 Å (Table 1 ▶) and the CCP4 suite of programs (Collaborative Computational Project, Number 4, 1994 ▶). The map is drawn with a minimum contour level of 1.5σ with 0.5σ increments. Four strong peaks observed in the Harker sections have been confirmed by analysis with SHELXD (Schneider & Sheldrick, 2002 ▶; data not shown).

