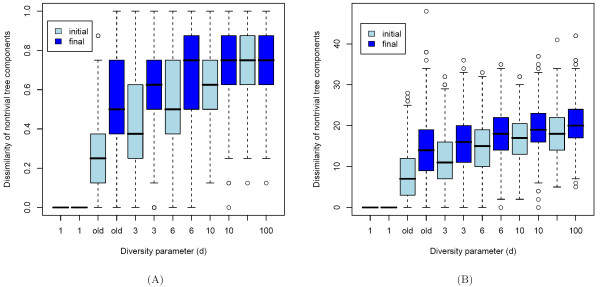
Figure 3.
Analysis of the diversity parameter. A) Diversity of the nontrivial components in the initial (light blue color) and final (blue color) mixture models for different cluster assignments. The tree comparisons in the experiments are performed with the similarity measure (5) based on the sum of the number of different edges. The larger d is in (3), the more diverse are the nontrivial components in the initial and the final models. B) Diversity analysis as in Figure 3A, but with the similarity measure (6) based on the sum of the number of different edges and the L1 distance of the vectors containing the levels of the events.

