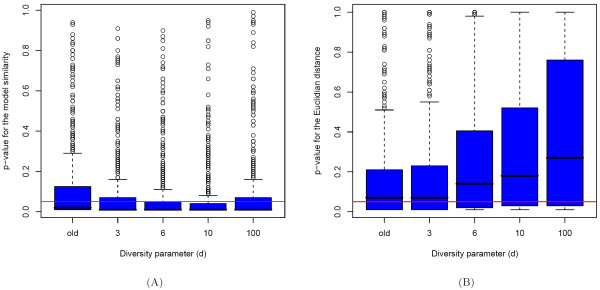
Figure 4.
Stability of tree topology and GPS for different cluster assignments. A) Significance of the similarity between the tree topologies of the true and the corresponding fitted mixture models. The red line depicts the threshold p-value = 0.05. The cluster assignments given by (3) with d ∈ {3, 6, 10} achieve the best estimation of the tree topologies. B) Significance of the similarity between the GPS vectors resulting from the true and the corresponding fitted mixture models. The red line depicts the threshold p-value = 0.05. The previous clustering (see [1]) and the new one (see formula (3)) with d = 3 achieve the best results.

