
Fig. 1.
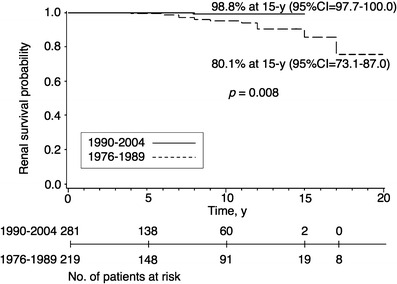
Kaplan–Meier plot of renal survival stratified by the initial biopsy year for children with IgA nephropathy. 95% CI 95% Confidence interval
Official websites use .gov
A
.gov website belongs to an official
government organization in the United States.
Secure .gov websites use HTTPS
A lock (
) or https:// means you've safely
connected to the .gov website. Share sensitive
information only on official, secure websites.
Kaplan–Meier plot of renal survival stratified by the initial biopsy year for children with IgA nephropathy. 95% CI 95% Confidence interval